Vue 3 + Apex Charts reference
A focused, copy-pasteable reference for building data-driven charts with Vue 3, Apex Charts (via vue3-apexcharts), and Bootstrap 5. Each page is a self-contained example of one chart type, written as a small Vue component you can lift straight into your own project. TypeScript, Vite, deployed to GitHub Pages.
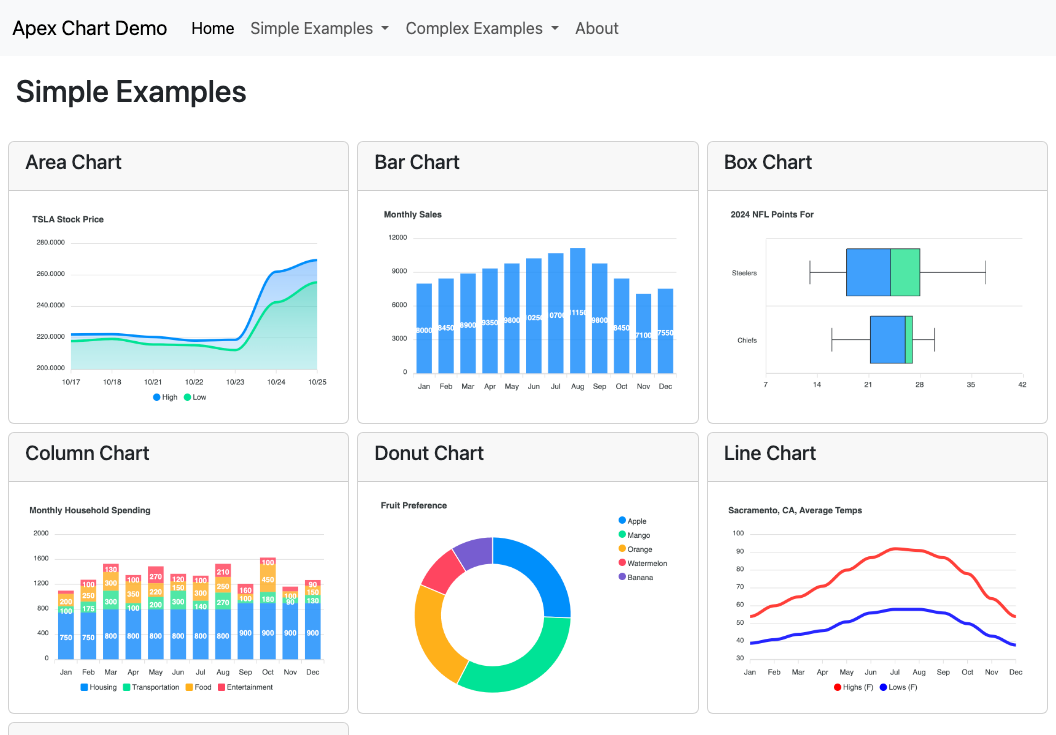
What's in the demo
Eight chart examples, each a separate route in the live demo and a separate file in the source. Click a chart name to see it live, or the source link to copy the implementation.
- Area. Stock high/low values over a date range
- Bar. A single series of monthly sales
- Box. Horizontal box plot of a distribution
- Column. Stacked columns of monthly spending
- Donut. Proportions of a whole (non-axis series)
- Line. Two smoothed series with custom colors
- Treemap. Hierarchical data sized by value
- Complex Area. An area chart with a live toolbar toggle
Tech stack
- Vue 3 with the Composition API and
<script setup> - TypeScript end to end, including the chart option and series shapes
- Vite for dev and production builds; Vitest for unit tests
- Apex Charts 5 via
vue3-apexcharts - Bootstrap 5 for layout and navigation
- CI on every PR (lint, format, build, test); deploy to GitHub Pages on push to
main
Run it yourself
Clone the repo, install in the vue subdirectory, and run npm run dev. Building Vue 3 + Apex Charts + Bootstrap from an empty project? The README links to TUTORIAL.md for a step-by-step walkthrough.