Interactive crime heatmap
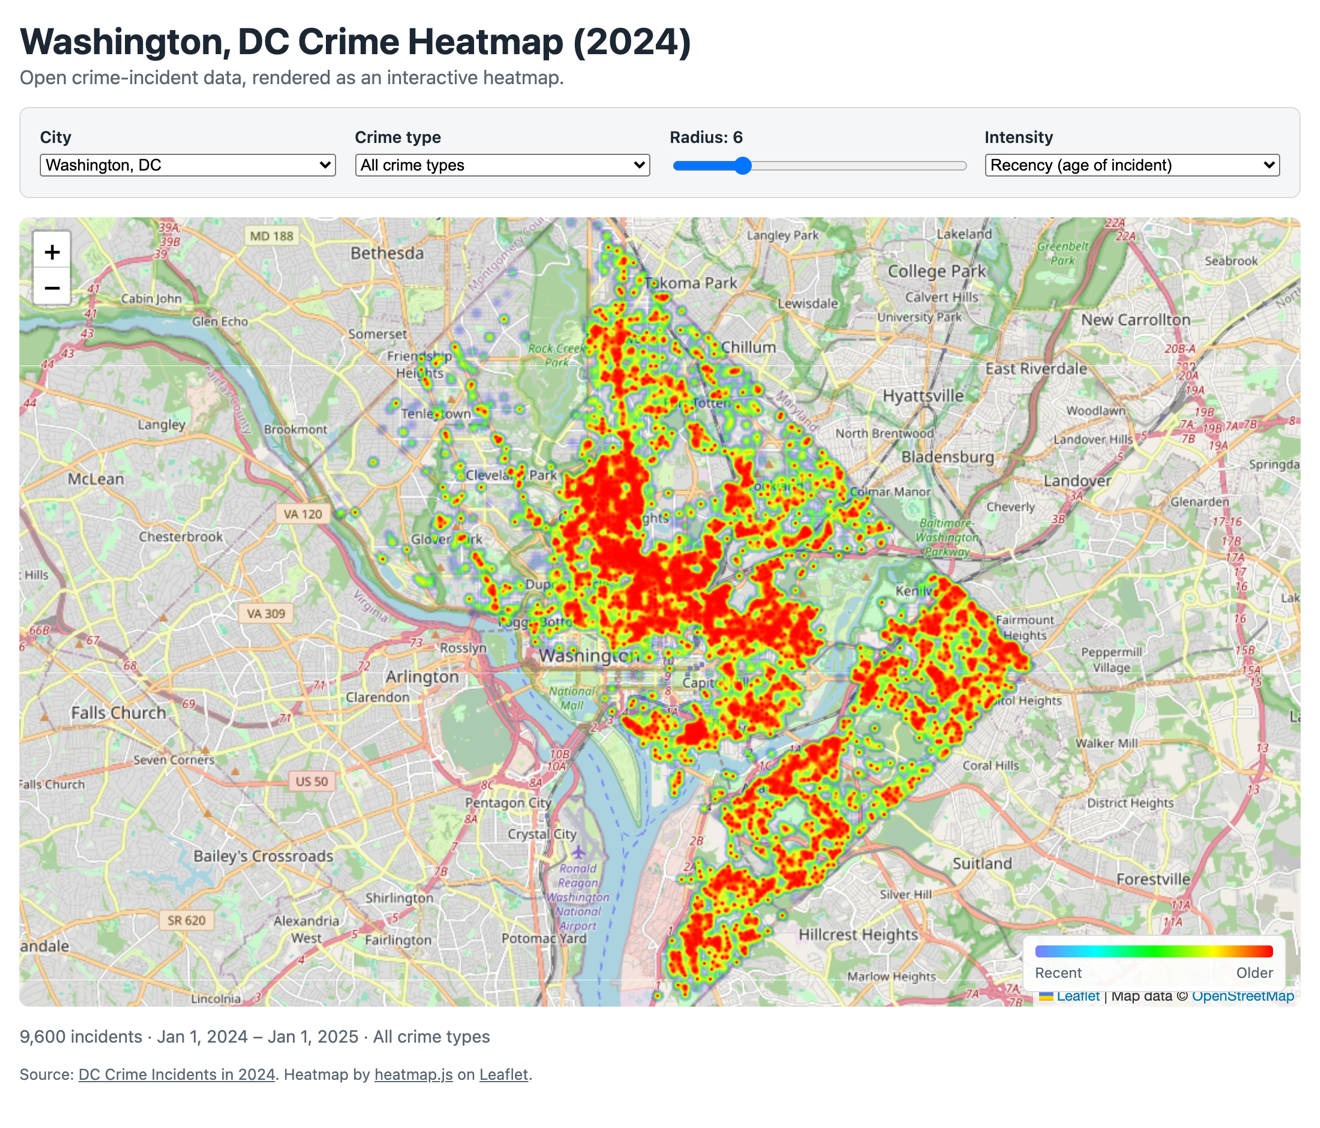
A heatmap of US city crime data overlaid on an OpenStreetMap base layer. Pick a city, filter by crime type, and change how the heat is rendered — incident recency, density, and radius are all adjustable live. Static deploy, no backend. Source on GitHub.
What's in the demo
- Datasets. Real 2024 open crime-incident data, curated to violent + vehicle-crime types and reduced to the fields the map needs. Two cities ship by default — Washington DC (~9,600 incidents) and Baltimore (~18,000 incidents) — with a documented pipeline for adding more.
- Visualization. heatmap.js layer on a Leaflet + OpenStreetMap map. Intensity is data-driven, not a plain point plot.
- Interactive controls. City preset, crime-type filter, radius slider, and an intensity toggle that flips between incident recency and density. A live status line shows incident count, date range, and the current filter; a color legend explains the gradient.
- Data pipeline. A small TypeScript script ingests the full city export and emits the compact JSON the browser loads, with parameterized inputs and per-city presets.
Tech stack
- TypeScript end to end — browser code and the data pipeline both
- Vite for dev server and the static production build
- Leaflet for the map, heatmap.js via the vendored leaflet-heatmap plugin for the overlay
- OpenStreetMap tiles for the base layer (HTTPS, attribution preserved)
- Static deploy, no backend — every route was previously
express.staticand the Express layer was removed during the polish pass - CI builds and deploys to GitHub Pages on push to
main
Run it yourself
Clone the repo, then from the app directory: npm install then npm run dev. To curate or refresh a city dataset, see the data-pipeline README; for a walkthrough of how the heatmap and Leaflet are wired, see TUTORIAL.md.